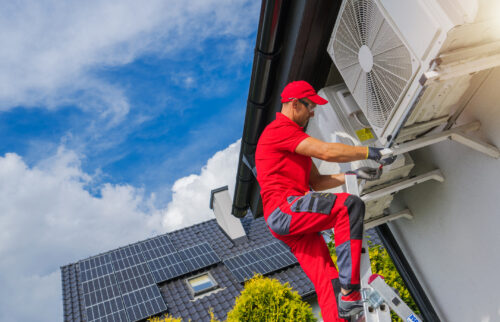
Maryland is facing an energy affordability crisis, with utility bills increasing rapidly and putting a strain on families. It is essential that Maryland find ways to reduce energy bills for households and businesses, while still maintaining reliability.
Simultaneously, Maryland must also continue its push to reduce climate pollution from burning fossil fuels in buildings and meet its climate emissemions targets. Climate change is already raising everyday costs for households and driving more and more severe weather related disasters. Additionally, direct combustion of fossil fuels in buildings is a major source of health-harming nitrogen oxide (NOx) pollution, which contributes to the state’s inability to meet federal air quality standards1. This pollution is already costing Marylanders $1.3 billion2 in health impacts annually.
A Clean Heat Standard (CHS) is a solution that can help address the affordability and climate crises at the same time by turning the tide on energy costs, climate pollution, and air pollution in Maryland. A CHS is an energy performance standard that would require companies providing fossil fuels used for heating (methane gas, propane, fuel oil, etc.) to provide a gradually increasing amount of “clean heat.” Clean heat can include heat provided by electric heating systems such as heat pumps, heat provided by low-emission fuels, or weatherization of buildings to reduce their energy use.
Evergreen commissioned Current Energy Group to create a model of a Clean Heat Standard for Maryland to examine the impacts of such a policy on heating equipment sales and stock, fuel usage, greenhouse gas (GHG) emissions, and utility bills (see the appendix for methodology). The model shows that a CHS can save Maryland ratepayers between $6.1 and $11.1 billion on utility bills between now and 2045, by upgrading both fossil fuel and electric resistance heating in Maryland to clean and efficient heat pumps. Such a program would support households in installing over 2.4 million residential space-heating heat pumps and 2.6 million residential heat pump water heaters. Climate and air pollution from buildings would be reduced by 90% by 2045, helping to achieve Maryland’s climate goals for the buildings sector.
Cost savings with a CHS come from reducing household energy use via efficient heat pump heating, from reducing or eliminating methane gas and fuel bills, and from system-wide savings from avoided spending on the methane gas distribution system, while keeping electric system costs similar due to greater efficiency. These savings more than offset the cost of providing incentives through the CHS, lowering utility bills for Marylanders while upgrading homes to increase comfort and resiliency. Additional savings of $9.2B from avoided health impacts are expected and would add to these benefits.
Careful design and complementary policies will help a CHS be more effective at reducing costs and lowering emissions. The model shows that a swift market transformation to heat pumps for space and water heating will reduce costs and is essential to meeting emissions targets. This means that near-term requirements in the CHS need to be set high enough to drive that rapid transformation. Further, the CHS should be a part of a cohesive clean heat and efficiency strategy for the state – one that includes updated building energy codes, energy efficiency incentives, utility regulatory directives, and equipment standards. The Maryland Public Service Commission (PSC) should require regulated utilities to submit long term clean heat plans and gas system plans that optimize for the lowest cost for ratepayers while maintaining safety and reliability. The PSC should make sure EmPOWER Maryland participants coordinate their programs with the CHS program and utilize any clean heat credits earned to lower costs for their electric ratepayers. State building energy efficiency codes should be updated to set a strong baseline for efficiency which will reduce costs for the clean heat standard.
A Clean Heat Standard is a key policy that can deliver lower utility bills, more comfortable and resilient buildings, cleaner air and improved health, and lower climate emissions. Maryland should move swiftly to adopt a Clean Heat Standard so Marylanders can reap the financial, health, and climate benefits of clean heat.
A Clean Heat Standard lowers utility bills Modeling shows a Clean Heat Standard can save Maryland ratepayers between $6.1 and $11.1 billion on utility bills through 2045 by upgrading fossil fuel and electric resistance heating to efficient heat pumps.
Buildings get 90% cleaner Climate and air pollution from buildings would fall 90% by 2045, with over 2.4 million heat pumps and 2.6 million heat pump water heaters installed.
Cleaner air saves billions more Reduced pollution from burning fuel in buildings could save an additional $9.2 billion in avoided health impacts.
Smart design keeps costs down Strong near-term targets, long-term utility and gas system planning, and updated building codes will make the standard more effective and less costly.
Meeting Maryland’s climate and building emissions targets
$6.1–11.1B
in net utility bill savings for Marylanders through 2045
$9.2B
in additional savings from avoided health impacts
90%
reduction in climate and air pollution from buildings by 2045
In 2022, Maryland passed the Climate Solutions Now Act (CSNA) which set statutory requirements for climate pollution reduction: 60 percent below 2006 levels by 2031 and net-zero by 2045. In 2023, the Maryland Department of the Environment (MDE) released a Climate Pollution Reduction Plan (CPRP) which outlined policy recommendations for achieving these goals.
The CPRP proposed a suite of policies for each sector of the economy, including nine policies to address direct emissions from the buildings sector, which account for 16% of Maryland’s greenhouse gas emissions3. Six policies were already existing with some recommendations for updates to those policies: Building Energy Codes, Electric Vehicle Standards for New Buildings, Building Energy Performance Standard (BEPS), State Government Lead by Example, State Incentives for Building Decarbonization, and EmPOWER Maryland.
The plan also recommended three new policies:
Gas system planning to make sure investments in the gas system are efficiently aligned with a net-zero future, which is being explored in the Future of Gas proceeding4 in the MD Public Service Commission (PSC)
Clean Heat Standard (CHS) to require that heating fuel providers deliver a steadily increasing share of clean heat, similar to a clean energy standard.
Zero-Emission Heating Equipment Standard (ZEHES) which would require new space and water heating systems to be free of emissions.
In 2024, Governor Wes Moore signed an executive order directing the Maryland Department of the Environment (MDE) to develop Clean Heat Rules, including both a Zero-Emission Heating Equipment Standard and a Clean Heat Standard.
Since 2024, MDE has been working to design the ZEHES and CHS regulations. In 2025, as a step towards the CHS, MDE finalized a Heating Fuel Provider Reporting Program which requires all companies selling methane gas, propane, fuel oil, coal, biofuels or other heating fuels to report on sales and deliveries of heating fuel in Maryland. MDE is now working on the specific parameters of the Clean Heat Standard.
The Clean Heat Standard
A Clean Heat Standard is an energy performance standard that would require companies providing fossil fuels used for heating (gas, propane, fuel oil, etc.) to provide a gradually increasing amount of “clean heat” services. Clean heat services can include heat provided by electric heating systems such as heat pumps, heat provided by low-emission fuels, and energy efficiency measures like weatherization of buildings to reduce their fuel use. This is similar to Maryland’s Renewable Portfolio Standard which gradually increases the amount of renewable energy electricity suppliers must procure from renewable sources.
“The Clean Heat Standard will guide heating fuel providers—such as methane gas utilities and fuel oil or propane delivery companies—to gradually reduce emissions by delivering cleaner heating options to Maryland’s homes and businesses. These clean heat services can include installing zero-emissions heating equipment, weatherizing buildings, and providing cleaner fuels. Companies that offer these services can earn credits for their efforts, creating a market-based incentive to cut emissions.”
Maryland Department of the Environment
Maryland’s proposed CHS system would require all heating fuel providers to demonstrate that they are reducing emissions by providing an increasing amount of clean heat. The amount of clean heat required each year is calculated as a steadily growing percentage of the climate pollution from their total fuel sales at the start of the program. Fuel providers will prove they are meeting these requirements by retiring “clean heat credits,” which they can generate by directly providing clean heat services, generate via a contract with a third party who provides clean heat services, or buy from other clean heat service providers – including directly from contractors or building owners who make efficiency upgrades. Each provider of heating fuels would be required to retire credits each year to comply with the CHS program, with credit requirements in 2045 equal to 90% of 2027 emissions.5
Clean heat credits could be earned through “installed measures”, such as zero-emission heating equipment for space and water heating and weatherization, or through delivered measures such as by providing low-emission fuels for heating buildings. For installed measures, clean heat credits will be earned for projected emission reductions for each year across the lifetime of the installed measure (for instance, a heat pump would earn credits based on estimated emissions reductions across its expected 15 year lifetime). Clean heat credits can be earned from actions anywhere in the state of Maryland and, unlike EmPOWER programs, are not limited to actions within a fuel provider’s territory.6 Clean heat credits would be based on the emission reductions from the clean heat service provided, with one credit awarded for each one ton of GHG reductions.
Low-income credits – from residential buildings where at least 51% of households are below 80% of the state median income;
Moderate-income credits – from residential buildings where at least 51% of households are below 120% of the state median income; and
Regular credits – from all other buildings, including commercial, industrial7, and other residential buildings.
MDE is considering requiring at least 18% of credits be low-income credits and 16% of credits be moderate-income credits, throughout the life of the program, based on their analysis that 18% of emissions from the building sector come from low-income households and 16% from moderate-income households.
Given this program design, MDE expects the Clean Heat Standard, and complementary policies, to achieve 90% reductions in GHG emissions from buildings by 2045.8 In addition, the Clean Heat Standard will reduce other air pollution like nitrogen oxides, lower heating and cooling costs, and increase access to incentives for clean heat measures.9
CHS is an “umbrella” policy that is designed to bolster existing building decarbonization programs and incentives that exist across Maryland’s building space. For that reason, actions taken under programs such as EmPOWER, BEPS, or ZEHES are eligible to earn credits under CHS. This is also true of actions that may have been taken based solely on consumer choice and market forces without any policy driver.10 As such, the CHS will work in concert with all other buildings programs to deliver the 90% reduction target, while supporting other programs and policies to achieve collective policy goals of energy affordability and market transformation.
Heating fuel providers are responsible for any costs associated with providing clean heat and meeting the requirements of the CHS. These costs can be offset with savings from reduced infrastructure spending and are likely to result in lower overall utility bills for consumers (see below for cost saving analysis). Any net costs or savings would likely be passed along to fuel customers, with the PSC reviewing these operating costs for regulated utilities. The PSC should ensure that regulated gas utilities have clean heat plans that minimize costs to ratepayers, both in terms of finding least cost solutions to comply with the CHS, and minimizing costs of infrastructure spending.
The CHS, given appropriate oversight from the PSC, should serve to reduce the costs of the EmPOWER program by allowing utilities participating in the EmPOWER program to earn clean heat credits when they make efficiency upgrades that reduce emissions from heating. They can then sell those credits which would reduce the overall EmPOWER costs borne by ratepayers.
Any other incentive funding, for instance from the federal government via tax credits, the Home Energy Rebate programs, or from agreements with, or regulations on, data centers would likely serve to reduce the costs of the CHS by motivating clean heat installations without the need for incentives from fuel providers participating in the CHS program (or with lower incentives required).
Current housing and heating in Maryland
Maryland has almost 2.6 million housing units and thousands of commercial buildings. The 16% of Maryland’s GHG emissions from fuel use in buildings are split roughly equally between the residential and commercial building sectors.
According to the US Census Bureau, of the homes in Maryland, 51% are detached single-unit homes, 25% are in 2-4 unit buildings, 1.4% are in mobile homes, and 22% are in larger multi-unit buildings.11 Approximately half of these homes were built before 1980, likely lacking modern insulation. About one third of households rent their homes.
Maryland home heating systems use a variety of fuels for their main heating source: 45% electricity, 43% utility gas, 4% propane, and 6% fuel oil.12 Based on data from the Energy Information Administration (EIA), 19% of homes in Maryland have a central heat pump as their main heating equipment13, with the rest of electrically heated homes using inefficient electric resistance as their primary heat source. The EIA also shows that 52% of Maryland homes have a secondary heating source which could include electric space heaters, fireplaces, or heat pumps that are not the primary heat source. Air conditioning can be found in 91% of homes in Maryland, with the vast majority of those having central air conditioning.14 For water heaters, 57% of households have electric heaters and 39% heat with methane gas, with 5-15% of homes and businesses using heat pump water heaters (depending on utility territory).15
Heat pumps are now outselling furnaces nationwide16 and even starting to outsell air conditioners. Heat pump water heater (HPWH) sales are still a small percentage of water heater sales but are projected to reach 40% of water heater sales by the end of the decade.17 Exact sales figures for Maryland are not easily available but the model assumes that in 2027 heat pumps and heat pump water heaters could potentially displace 10-12% of the sales of fossil fuel furnaces and water heaters in the residential market and 2% of the commercial market (see methodology).
Home Energy Affordability
When looking at the affordability of heat pumps for space and water heating one needs to look at both the up front costs for installation and the operating costs for energy usage, in comparison to other fuel choices such as piped methane gas, propane, fuel oil, and electric resistance.
Recent analysis from RMI shows that virtually all customers currently heating with delivered fuels (propane and fuel oil) can save between $1,200 and $1,600 on average annually when switching to a heat pump. Similarly all single-family households currently heating with electric resistance can save $2,536 on average when switching to a heat pump.18 As noted above, the CHS would allow clean heat credits to be generated from anywhere in the state, which could allow incentive programs in early years to focus on customers who can save the most money when switching to a heat pump.
For customers currently heating with methane gas, results are more mixed. Efforts are underway to create greater savings for heat pump customers through changes to electricity rates. Fairer rates for heat pump customers would mean more households will save when switching to a heat pump, and those who already save will save even more. For instance, recent analysis19 shows that an electricity rate that does not overcharge heat pump customers could allow 86% of households in the BGE territory to save when switching from methane gas to a heat pump for space heating. Even with the current rates, which overcharge households with heat pumps, an upgrade from methane gas to a heat pump has only a modest impact on bills, raising them by $5/month on average with 48% of households having lower bills.
Future prices for methane gas and electricity in Maryland will depend on a variety of factors including demand growth, distribution and transmission build out, and production costs. Both are currently trending upwards and volatile, making it critical that homes and businesses upgrade their buildings to increase efficiency and decrease energy use.
Electricity prices have risen 51% since 2020 according to the EIA.20 Analysis from the OPC shows that over the long term, the “biggest drivers of higher utility bills for Maryland customers are increasing distribution rates and extreme weather,”21 but a portion of recent increases can be attributed to increased demand from data centers and issues with the PJM capacity auctions. High electricity prices make it all the more important that people upgrade their homes to be more efficient, but can create a disincentive to switch from methane gas, depending on the relative costs for heating with the two fuels.
The price of residential methane gas has also increased, more than 23% since 202022, driven primarily by increases in gas distribution spending.23 Methane gas costs are projected to continue to increase rapidly with winter bills potentially doubling by 2035 based on infrastructure spending projections and the potential for high wholesale methane gas prices. Methane gas costs could increase even further, as much as 375% by 2035 in some scenarios24, as customers electrify their homes and shift away from gas leaving fewer customers to pay for existing infrastructure. This is a function of existing market forces, with increased efficiency and electrification resulting in a decline of 26% in methane gas use per residential customer since 2014.25 This potential for drastically increased methane gas prices makes it likely that customers will save over the long term when switching from methane gas to a heat pump, even if there are not significant savings in the short term.
Up Front Costs for Clean Heat Equipment
There are various data sources for estimates of the up front costs for installing heating equipment, none of which are authoritative or conclusive. Quotes for installation can vary significantly from building to building, and from contractor to contractor, and are changing quickly as the market evolves.
For new construction all electric homes with heat pumps are already less expensive to build than the comparable home with a furnace and air conditioner. For retrofit replacements, estimates range from $5,000-$12,000 of additional costs when replacing a furnace with a heat pump compared to replacing with a similar furnace.26 These figures account for the potential need for electrical and ductwork upgrades. These figures do not account for the cost of an air conditioner, which is not required once a household has a properly sized heat pump, but is often replaced on a different cycle from furnace replacement. For multi-family housing, window heat pumps have been shown to be a cost effective option for replacing boilers, that can reduce utility bills as well27.
Insulation and weatherization are estimated to cost approximately $5000 for retrofitting a single family home in Maryland.28
For heat pump water heaters, estimates for additional costs compared to replacing with a methane gas, propane, or delivered fuel appliance range from $1,088-$3,810 with most estimates centering on $2,200.29 Higher figures include the costs of an electrical panel upgrade, which is not necessary in most cases.
Higher upfront costs for these clean heat upgrades are a disincentive for households to upgrade, even when they might save money on utility bills. Incentives and/or financing are often needed to support households in upgrading their homes to clean and efficient heat pumps.
Current Incentive Programs for Heat Pumps and HPWHs
Most Maryland households can currently get incentives from their local utility through the EmPOWER program. In 2025, EmPOWER residential programs totaled $213M in support to households.30
Incentives vary by utility and have changed over time. Current incentives as of September 2026 are as follows:313233
Utility
Full Home Performance Incentive including Heating and Cooling
Heat Pump Water Heater Incentive
Electrical Upgrades
BGE
Up to $15,000
$1,600
Up to $1,500
Pepco
Up to $15,000
$1,600
Not offered
Potomac Edison
Up to $4,000 for heat pump
$2,500
Up to $3,000
Delmarva
Up to $15,000
$1,600
Not offered
SMECO
Up to $15,000
$1,600
Up to $2,000
Proposed incentives for the 2027-2029 compliance period have been filed with the PSC but not yet approved. Proposed incentives for all of the above utilities are: up to $25,000 for full home performance incentives, $5,000 for a heat pump water heater, and up to $4,500 for electrical system upgrades.34
In 2026, Maryland also dedicated $72.65M from its Strategic Energy Investment Fund (SEIF) to support heat pumps for low and moderate income households. The Maryland Energy Administration (MEA) will distribute the funds through forthcoming grant and rebate programs. MEA also has existing SEIF-funded programs that provide support for clean heat such as, the Energy Efficiency Equity Grant Program ($11.2M), Decarbonizing Public Schools Program ($17.4M), Local Government Energy Modernization Program ($2M), and funding to DHCD for multifamily upgrades.35
MEA has also applied for federal funding of $136M for the Home Efficiency Rebates and High-Efficiency Electric Home Rebate (HEEHR) programs which will provide up to $14,000 per low-income households as rebates for home energy upgrades. Recent guidance from the Department of Energy (DOE) has limited the ability of the HEEHR program to support switching from fossil fuel equipment to electric. Maryland is still waiting on approval from DOE for this funding.
Evergreen commissioned Current Energy Group to develop a model of Maryland’s Clean Heat Standard to be able to analyze the program (See appendix for methodology).
The system models all of Maryland’s residential and commercial buildings and their current mix of heating systems and fuels. It estimates the number of buildings that are likely to be available each year for clean heat upgrades based on the expected lifetime of existing heating equipment and assuming that, in general, equipment will only be replaced upon failure.
The model also accounts for the current market share for heat pumps, furnaces, and electric resistance heating equipment, as well as sales of electric water heaters, fossil fueled water heaters, and heat pump water heaters as a baseline.
The model assumes that to earn clean heat credits from installed measures, incentives will be given for installing heat pumps for space heating and water heating in residential and commercial buildings. The model calculates the number of clean heat credits earned from each installed measure by including the emissions reduced from decreased fossil fuel or electricity use and subtracting the emissions generated from the new system’s electricity use (based on projected electricity emissions in each future year). The model allows the amount of incentive provided for clean heat measures to vary from year to year (more on this below), and calculates a cost per ton of avoided emissions for a measure based on that amount and the emissions avoided per measure.
For emissions reductions from alternative fuels, the model calculates a typical level of emission reductions from “renewable natural gas” (RNG), though in reality emissions reductions for alternative fuels will vary based on the fuel stock and other factors. The model also calculates a low and high price per ton for avoided emissions based on a range of prices for low carbon fuels (see appendix for methodology for more info).
The model assumes that the rate that the market share of clean heating equipment can change in a given year is limited by various factors including economics, workforce dynamics, consumer awareness, etc. The potential rate of change for each year is an input parameter (see table below) into the model and represents a market transformation curve for residential and commercial heat pumps and heat pump water heaters. For instance, if the current market share for space heating heat pump sales is 12% and the parameter for rate of change for that year is set at 100% then the market share for the next year would reach 24%.
The model also takes as input the size of the incentive deemed necessary to drive a certain rate of change in the market. Incentive levels for the model were chosen based on incentives in existing programs in Maryland and across the country, as well as the incremental costs for various clean heat measures (See methodology for more info). For instance, the model assumes that a $2,500 incentive, which would generally cover the incremental cost for a residential heat pump water heater, can drive a doubling in market share, and a $1750 incentive could drive 75% growth in market share, etc. For space heating heat pumps, the model assumes that an incentive of $2500 per ton of heating capacity could drive a doubling in market share. That means for a single family home which might have a 3 or 5 ton heat pump, that an incentive would be $7,500 or $12,500 which would generally cover the incremental cost (see Up Front Costs above).
Incentives for low-income households are assumed to be 2.5 times the incentive for market rate households, and moderate-income households are assumed to be 1.5 times the market rate incentives. These allow incentives to approximately cover the full cost of installed measures in low-income households and cover the incremental cost for moderate-income households. For a heat pump water heater that could mean an incentive of up to $6,250 for low-income households which would generally cover the full cost of most water heater installations. For a 3 ton heat pump, a low-income household could receive up to $18,750 as an incentive which could cover the full cost of an upgrade.
The model assumes that incentives would be lower than these values in years when the market is not changing as quickly. For instance, once the market share for heat pumps and heat pump water heaters reaches 100%, costs for these products and installations will be lower, and the model assumes a lower incentive level would be necessary to maintain that market share.
Clean Heat Measure
Market Rate Incentive
Low-Income Incentive
Moderate-Income Incentive
Heat pump – 1 ton
$2,500
$6,250
$3,750
Heat pump – 3 ton
$7,500
$18,750
$11,250
Heat pump – 5 ton
$12,500
$31,250
$18,750
Heat pump water heater
$2,500
$6,250
$3,750
The model calculates the incentive level for a given year based on the market transformation curve, while also factoring in how quickly incentives might be changed from year to year in a real world program. From these year by year incentive levels, the model calculates the cost per ton of emission reductions for each measure over the lifetime of that measure. The model then looks for the lowest cost scenario for achieving the target emission reductions in the target year (in this case, 90% by 2045).
The model has various additional inputs that adjust costs and deployment for insulation, the pace at which incentives can go down from previous years, and the percent of already electric space and water heating systems that are upgraded to heat pumps. These factors can affect the overall cost of the program and the eventual amount of electricity consumed for heating in the state.
The model shows that to achieve the 90% reductions by 2045, incentives should start high to drive rapid change in the market, and can then be reduced once heat pumps and heat pump water heaters become the norm and equipment and installation costs come down. The model assumes a baseline level of incentives will continue throughout the program to maintain a 100% market share, though in practice other policies, such as the ZEHES, may make such ongoing incentives unnecessary, or only necessary for low- and middle-income households.3637
User Input
Description
Set Point for Main Scenario
Program start year
The first year in which clean heat credits must be retired.
2028
Program end year
The year in which the target emissions reductions must be met.
2045
Emission reduction target
Percent reduction in emissions compared to baseline
90%
Market transformation curves
How high the sales percentages of clean heat equipment can reach in a given year
Moderate Growth
Incentive levels
How much of an incentive is necessary to drive the expected growth in sales of that measure
See Appendix
Percent of households receiving low-income incentives
What percentage of households receive 2x of the market rate incentive for each measure
18% of all credits
Percent of households receiving moderate-income incentives
What percentage of households receive 1.5x of the market rate incentive for each measure
16% of all credits
Insulation cost premium
What percent of extra incentive is required to motivate the installation of insulation at a residential or commercial building when HVAC is upgraded.
20%
Residential insulation deployment
What percent of residential HVAC upgrades include the insulation premium
40%
Commercial insulation deployment
What percent of commercial HVAC upgrades include the insulation premium
40%
Max incentive decay
How much clean heat incentives can decrease in a given year compared to the previous year. This can be used to reduce incentive “cliff” where incentives drop precipitously in a given year.
50%
Assumed electric resistance to heat pump conversion of initial resistance stock: space heating
What percentage of homes that currently heat with electrical resistance are upgraded to heat pumps when their existing systems fail
Follows same market share as fossil fuel conversions
Assumed electric resistance to heat pump conversion of initial resistance stock: water heating
What percentage of homes that currently heat water with electrical resistance are upgraded to heat pump water heaters when their existing water heater fails
Follows same market share as fossil fuel conversions
Share of new electric construction receiving heat pumps: space heating
Percentage of new homes that historically would have installed electric resistance now install heat pumps for space heating and cooling
100%
Share of new electric construction receiving heat pumps: water heating
Percentage of new homes that historically would have installed electric resistance now install heat pumps for water heating
100%
Modeling Results
The model shows that a CHS can achieve a 90% reduction in building sector emissions by 2045 through the deployment of a wide variety of clean heat measures.
Total emissions from building heating and hot water systems, including lifecycle emissions from onsite combustion and emissions from electricity. Emissions decline in the Business as Usual (BAU) scenario is due to reduced emissions per kWh of electricity and assumed improvements in building efficiency. Deeper emissions reductions in the CHS policy scenario is from reduced combustion of fuel and greater electrical efficiency from heat pumps.
Modeling results
2.4M+
residential space-heating heat pumps installed, a 95% reduction in homes heated with fossil fuels
2.6M+
residential heat pump water heaters installed, a 92% reduction in homes heating water with fossil fuels
63%
reduction in commercial building space heated with fossil fuels
54%
reduction in commercial water heated with fossil fuels
65%
reduction in total energy used, from heat pump efficiency
92%
reduction in fossil fuels burned, with the health benefits of cleaner air
Given the above input parameters, the model does not show the deployment of any alternative fuels to achieve the 90% emissions reductions by 2045, with other clean heat measures providing emissions reductions at a lower price per ton. In scenarios with parameters set to assume a slower rate of growth in the market share of heat pumps, moderate amounts of alternative fuels are deployed to meet the target emissions reductions.
Investments in clean heat
Based on this model scenario, a CHS, including upgrades to buildings heating with electric resistance, could drive as much as $15.3B billion in incentives toward clean heat measures, with $10.1B billion going to upgrade residential buildings and $5.2 billion going to upgrade commercial buildings.
Upgrades from Fossil Fuel
Upgrades from Electric Resistance
Total
Residential Space Heating
Low-income
$2.0 billion
$900 million
$2.9 billion
Moderate-income
$1.0 billion
$500 million
$1.5 billion
Market-rate
$1.7 billion
$800 million
$2.5 billion
Total Residential Space Heating
$4.7 billion
$2.2 billion
$6.9 billion
Water Heating
Low-income
$600 million
$700 million
$1.3 billion
Moderate-income
$300 million
$400 million
$700 million
Market-rate
$500 million
$600 million
$1.1 billion
Total Residential Water Heating
$1.4 billion
$1.7 billion
$3.1 billion
Total Residential Space and Water Heating
$6.1 billion
$3.9 billion
$10.1 billion
Note that these figures do not account for any other incentives from other sources such as the EmPOWER program, local incentives, or federal incentives. For instance if a $2,000 federal tax credit were reinstated and made refundable for all heat pumps and heat pump water heaters this could provide over $5 billion in incentives, potentially reducing the funding needed from the CHS to achieve the same emissions reductions.38
Electric Resistance Upgrades
MDE intends to allow clean heat credits to be earned through upgrades of electric resistance space and water heating to more efficient heat pumps. These credits would be based on the emissions reductions from reduced electricity use, rather than a reduction in onsite fuel combustion. In early years of the program such emissions reductions could be substantial, but will decrease as the emissions per kWh decreases with greater decarbonization of the electric grid. Eventually, when electricity emissions reach zero, upgrading electric resistance would no longer generate any emissions reductions, and therefore would not generate clean heat credits, but would still provide significant benefits in reducing loads on the grid and lowering energy bills for customers.
Given the structure of the model, and the assumption of a zero-emission grid by 2045, the model does not directly deploy electric resistance upgrades directly as part of the modeled CHS, but rather treats those upgrades separately, assuming they are motivated by the savings from efficiency rather than clean heat credits.
As noted above, virtually all households using electric resistance for space and water heating will see significantly lower utility bills by switching to heat pumps. Savings from these upgrades can pay for themselves in 3-7 years39, or even quicker if incentives are provided to reduce upfront costs. A typical single family household can save $23,00040 over the life of their appliances by upgrading electric resistance space and water heating to heat pumps.
Using the incentive levels projected in the CHS model and applying those same incentive levels to customers switching from electric resistance to heat pumps, the model estimates that a $5.4B investment in incentives could motivate upgrading approximately two-thirds of the electric resistance heating in Maryland and drive $10.1B in utility bill savings between now and 2045.41 That is a net of $4.6B in savings, and that savings would continue to grow beyond 2045.
In practice, because the operational savings are already significant for switching from electric resistance to heat pumps, these incentives could likely be much lower, resulting in even higher net savings. For higher income households, unsubsidized loans to cover the up front costs for these upgrades may be sufficient. For low- or middle-income households zero- or low-interest financing, possibly through Inclusive Utility Investment on-bill financing, could provide the needed funding, though rebates and direct install programs would also be appropriate for many cases. As noted above, the federal Home Efficiency Rebates and High-Efficiency Electric Home Rebate (HEEHR) programs will provide up to $14,000 per low-income households and may need to be focused on electric efficiency upgrades.
Energy Bill Savings
The model shows that a CHS is likely to result in significant energy bill savings (combined fuel and electric bills), with customers switching from fossil fuels saving $3.3B between now and 2045, and continuing savings beyond that date. This savings is based on statewide average rates for electricity and fuels, and shows how the savings from reduced fuel use exceeds the cost of the electricity used to heat with heat pumps. Simultaneously upgrading electric resistance heat to heat pumps saves an additional $10.1B for a total of $13.4B in utility savings through 2045. The savings come from reduced energy consumption due to the increased efficiency of heat pumps compared to fossil fuel or electric resistance heating. This savings is based on current fuel and electricity prices given the difficulty in predicting future prices (as discussed above).
The cost of the CHS could be completely offset by $8-13B of spending on maintenance of the gas system that could be avoided (see Gas System Spending below). Electric system spending is not expected to increase due to the CHS so is not included as an additional expense here (see Electric System Spending below) A conservative estimate of $8B in reduced gas system spending results in a net savings of $1.4B from switching from fossil fuels to efficient heat pumps. When electric resistance to heat pump upgrades are included, the net savings jumps to $6.1B. If savings from avoided gas system costs reach $13B then savings would reach $6.4B for fossil fuel conversions and $11.1B when electric resistance upgrades are included.
CHS Including Electric Resistance to Heat Pump (low gas system savings)
CHS Policy (high gas system savings)
CHS Incentives
$9.9B
$9.9B
Electric Resistance to Heat Pump Incentives
$5.4B
$5.4B
Total Incentive Costs
$15.3B
$15.3B
Savings
Utility Bill Savings (gas/fuel + electric)
$13.4B
$13.4B
Avoided Gas Infrastructure Costs ($8–13B)
$8B
$13B
Total Savings
$21.4B
$26.4B
Net Savings
$6.1B
$11.1B
Note: As discussed below under Electrical System Spending, there is not expected to be a significant increase in spending on the electrical grid due to building electrification, given a simultaneous shift from electric resistance heating to heat pumps.
The above savings on energy bills does not include any projections for savings from reduced health impacts or from avoided climate impacts. Given that health impacts are estimated at $1.3B per year,42 the savings would be significant over the 18 years of the program and beyond. The model shows a 42% cumulative reduction in buildings-related fossil fuel consumption over the 18 year program, which could translate into $9.2B in health savings across the life of the program43. After 2045, the savings would continue with a 90% reduction in pollution potentially saving over $1B per year in health costs ongoing.
Gas System Spending
Analysis from the Office of the People’s Council (OPC) shows that the major gas utilities in Maryland currently spend about $1 billion annually on capital expenditures to maintain and expand the gas system.44 This includes spending under the STRIDE program as well as other capital investments made outside of STRIDE. In 2025, OPC estimated, using conservative assumptions of spending continuing at current levels, that over the next 18 years, utilities will spend $18 billion on gas system infrastructure. Spending may be considerably higher given that gas utility spending on infrastructure has been on a sustained upwards trajectory both in Maryland and across the country.45
In 2025, the Next Generation Energy Act (NGEA) (HB 1035) made major reforms to the STRIDE program which could reduce gas system spending, but it is unclear by how much given the delays in implementation and how the PSC will interpret the legislation. Spending on the gas system may continue growing, with utilities increasing their capital spending outside of the STRIDE system.
Of this $1 billion in capital spending each year, $160 million is estimated to be spent on expanding the gas system through line extension allowances.46 In 2025 the PSC made a decision to end line extension allowances but implementation of that decision has recently been put on hold, allowing this spending to continue unchecked.
Even as spending on the gas system has increased, total residential methane gas usage in Maryland has been flat over the last 30 years,47 with per customer use declining due to greater efficiency and electrification.48 Under any scenario that aligns with the Climate Solutions Now Act, gas utilities are likely to see a significant decline in the number of customers on their system as well as the amount of methane gas sold. This should result in some decline in the amount of money spent on the distribution system, but how much money would be saved depends on how this process is managed. In a well managed transition scenario, the gas system could be systematically pruned, with entire neighborhoods having their gas pipelines decommissioned rather than replacing aging pipes that serve that neighborhood. In an unmanaged transition, which does not consider geographic concentration or systematic pruning, aging pipes might be replaced despite servicing fewer and fewer customers in a neighborhood. Studies in California, Illinois, and Washington D.C. have shown that a managed transition could save 47% to 72% on capital expenditures over a 20 year time frame.
Gas system spending under a CHS is estimated to range from $5B to $9.5B. The graph above shows the median value with whiskers showing the range of spending.
This represents the potential to reduce spending in Maryland by $8.5-13 billion over an 18-year period (based on 47% to 72% of $18B). This should include all money currently being spent on line extension allowances, as well as savings from avoiding pipeline replacements and repairs. Longer term, the savings beyond 2045 would be even greater as both capital and operating expenses are reduced in concert with a declining customer base. Unfortunately, a managed transition is not automatic under a Clean Heat Standard, as it relies on decisions made by the PSC and by utilities to reduce costs through thoughtful long term gas system planning and an end to line extension allowances. With up to $13 billion on the line, it is critical that policies are put in place now to reduce costs over the long term (see Policy Implications below).
Customer savings from the CHS will be even higher if the cost of clean heat credits is considered an operating expenditure rather than a capital expenditure. The $18B in projected gas infrastructure spending could result in up to $65B49 in costs to ratepayers since those capital expenditures earn a return on equity over the lifetime of the infrastructure. The PSC would likely treat the cost of clean heat credits as operating expenses which are passed through to ratepayers without an extra profit margin, similar to the recent changes to how expenses from the EmPOWER program are handled.50 At a minimum, the PSC should allow a much lower rate of return for any amortization of costs for clean heat credits than the standard return on equity. Note that immediate pass through of CHS costs would lower the long term costs to rate payers, but may cause a timing mismatch between up front expenditures on clean heat and longer term savings on avoided infrastructure spending, which could increase methane gas rates in the short term. Given the uncertainty of how CHS expenditures will be treated, this analysis uses the most conservative approach and treats them as if they are capital expenditures similar to infrastructure spending.
Electric System Spending
One might expect with a broad transition to clean heat that the electrical system would need to be dramatically expanded to meet increasing electric loads from heat pumps and heat pump water heaters that replaced fossil fuel based heating. In fact, a simultaneous transition of electric resistance heating to heat pumps offsets most of the increase in electricity usage from buildings switching to heat pumps from methane gas or delivered fuels. The net increase in electricity use is minimal, and usage may even go down depending on the relative pace of these two transitions.
Total residential and commercial electricity usage for heat would only increase from current usage by 18% by 2045, or approximately 2.7 TWh/year according to the model. This is much smaller than the projected 10TWh/year loads from the 1.2 GW of data centers already being planned in Maryland, and only 5% of the 57.5 TWh/year that PJM projects for load growth in Maryland by 2045.51 In addition, heat pumps and heat pump water heaters are loads that can easily be enrolled into virtual power plants or other distributed resource programs, so that loads can be curtailed and shifted during times of peak demand and grid stress.
Though a full peak load analysis is beyond the scope of this model, the 2026 forecasted projections for peak loads in the PJM region show summer peaks continuing to exceed winter peaks through 2045, despite winter peak loads growing at a slightly faster rate than summer peaks, and significant increases in these peak load projections compared to 2025 forecasts. This is true across the PJM region, as well as for the PJM Mid-Atlantic Region and the relevant sub-zones in Maryland.52 Even further, their projections for the BGE, Delmarva Power and Light, and PEPCO sub-zones show winter peaks remaining below historic summer peaks through 2045, meaning that regionally there is sufficient grid headroom to handle projected growth. While there may be localized needs for upgrades, these forecasts do not predict major upgrades will be needed to meet building electrification needs across the state or regional level.
In 2023 the MD PSC studied the impact of electrification on load growth and peak load and determined that the growth would be “quite manageable”.53 They determined that by expanding the amount of energy efficiency and load flexibility programs, peak load growth could be dramatically reduced than under scenarios assuming current programs. Through 2031 they show that peak load would increase only 0.3% per year in a high electrification scenario with best in class technologies and with expanded demand side management programs. This is similar to what is expected under a CHS which would drive high electrification with increased efficiency and the potential for load shifting through VPPs and other demand response.
Recent analysis from RMI54 on peak loads determined that Maryland has roughly 2 gigawatts of winter headroom (20% of grid capacity), enough room to add space heating pumps in 1.7 million homes within current grid capacity. They also note that grid expansion for data centers may increase this winter headroom since data centers use more energy in the summer for cooling loads.
These studies show that upgrades driven by a clean heat standard can be integrated into the existing growth plans for the Maryland grid without significant system-wide additional infrastructure buildout that would raise electricity delivery costs, though there may still be some need to address localized capacity constraints. Furthermore, increased overall consumption without dramatically increasing peak loads will lead to higher grid utilization, resulting in lower distribution costs per kWh for everyone.
Policy Implications
Modeling of the Clean Heat Standard provides insights into how the CHS and other policies and programs should be structured to minimize costs and maximize the benefits of the various building policies in Maryland.
Rapid Market Transformation Reduces Costs
The modeling of the Clean Heat Standard shows that emission reductions of 90% by 2045 are possible at an affordable cost but only if the market share of heat pumps is able to increase rapidly. In scenarios with slower sales growth, emissions reductions fall short, even with significant deployment of alternative fuels, or the cost of the program increases by 30% or more.
Thus, it is imperative that Maryland, in a coordinated way across agencies, support a swift market transformation to achieve its emissions targets affordably. This means providing complementary policies such as workforce development, streamlined permitting, well-designed incentive and financing programs, and consumer education. Maryland should work with manufacturers, distributors, and installers to remove all roadblocks to rapid deployment of efficient clean heat measures.
Emissions reduction targets for the early years of the CHS program should also be set to drive a rapid transition to clean heat balancing near term costs with overall program costs through 2045. Modeled scenarios with slower sales growth from lower annual clean heat targets yield lower costs in the short term, but actually increase the total cost of the program between now and 2045. Striking the right balance will be key to maintaining support for the program while managing long term costs.
Long term utility planning reduces costs
It is critical that the PSC engages directly with regulated utilities to require them to provide long term clean heat plans that optimize for long term cost reductions for customers. The PSC should closely scrutinize utility programs for earning clean heat credits, comparing costs against the statewide market rate for clean heat credits to make sure that utilities are being prudent in how they comply with the CHS. In addition, the lowest cost long term plans may mean earning more clean heat credits in the short term than are absolutely necessary to meet annual targets, with credits saved for future years. Such early action could drive down long term costs by driving market transformation and lowering the level of incentives needed in the future.
As noted above, the PSC should also require long term gas system planning that optimizes spending on gas distribution infrastructure to provide ongoing safety and reliability while minimizing costs to rate payers. The PSC is already considering such questions in its “Future of Gas” proceeding (Case No. 9707) and should move quickly in this process to “address how natural gas company planning practices should be structured on an ongoing basis” including “how gas and electric planning practices should be aligned.”
Clean heat credits should be used to lower EmPOWER costs
As noted above, the CHS, given appropriate oversight from the PSC, should serve to reduce the costs of the EmPOWER program when utilities participating in the EmPOWER program earn clean heat credits as they support efficiency upgrades that reduce emissions from heating. The PSC should ensure that any actions taken by a utility under the EmPOWER program that earns clean heat credits, should use the full value of those credits to lower the cost of the EmPOWER program for electric ratepayers, as opposed to lowering the cost of methane gas for their ratepayers. For instance, the PSC could require that electric utilities, including dual fuel utilities, sell any clean heat credits earned from their electric system’s EmPOWER program to their gas system or on the broader market for clean heat credits. This would ensure that electric ratepayers reap the benefits from the value of any clean heat credits earned, reducing EmPOWER costs and thus lowering electric rates.
Stronger Building Energy Codes Reduce Costs
Maryland should update state building energy efficiency codes to require higher levels of efficiency in new buildings, including codes that encourage or require fully-electric new construction and disallow electric resistance as a primary heat source in new buildings.55 Under a CHS, builders can earn clean heat credits if they build new buildings that have lower emissions than those required by existing building codes. New homes built to updated energy codes already save owners up to $15,00056 over the life of the home, so should not require additional incentives from selling clean heat credits. By updating building codes, the CHS can focus incentives on upgrading existing buildings, where the cost of efficiency upgrades are often higher than installing similar equipment in new buildings. And by shifting electric heating in new construction away from inefficient electric resistance systems, Maryland can immediately save those households on their home heating bills.
Conclusion
A well designed Clean Heat Standard can be a key driver of affordability in Maryland, when enacted as part of a comprehensive policy landscape including strong PSC oversight to reduce gas distribution system spending. A transition to clean heat can drive $6.1B to $11.1B in energy bill savings while reducing climate emissions from buildings 90% by 2045. Savings from health impacts could yield an additional $9.2B in savings. Maryland should move swiftly to adopt a Clean Heat Standard so Marylanders can reap the financial, health, and climate benefits of clean heat.
$6.1–11.1B
in energy bill savings from a transition to clean heat
90%
less climate pollution from buildings by 2045
$9.2B
in additional health savings from cleaner air in Maryland homes